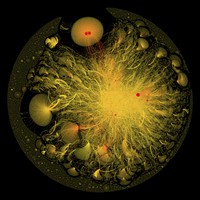
Graphical visualisation of data extracted from Tweets on Twitter containing the hash tag breast cancer. Over an 8 week period, 92915 individual Tweets containing #breastcancer were collected. Data was mined to identify the author of the tweet and to link them to any other twitter user that they retweeted or mentioned within the text of their tweets.
The 'double yolk' structure (top of image) indicates common mentions between two accounts. This area of the graph provides a graphical expression of trending data in Twitter as it represents one tweet which was retweeted thousands of times.
Twitter users are regarded as 'nodes' within the network and the relationships between them are 'edges'. Node size is determined by 'pagerank' which is determined by the number and relative importance of other nodes that link to it. The weight of the edges between nodes is determined by the number times that a particular relationship is expressed within the data.